Monophasic Versus Biphasic Glucose Curves: The Science
You may have noticed that your glucose pattern after a high sugar or high carbohydrate meal shows one of two curves: one with a single peak, called “monophasic,” or a curve with two successive peaks, called “biphasic.” There are important implications involved in the differences between these curves, and this post seeks to explain how they might reflect your metabolic fitness.
Some simple definitions are helpful: A monophasic glucose curve shows a single peak in glucose, followed by a continuous fall. In contrast, a biphasic curve shows a peak at about 30-60 minutes after a meal, and then a decrease in glucose followed by another rise between 90-120 minutes later (See Figure 1).
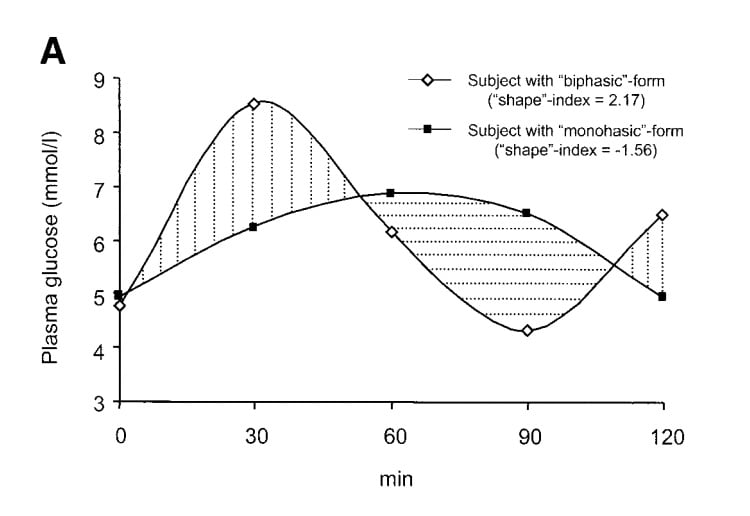
Depiction of monophasic (black dots) versus biphasic (white dots) glucose curves. Tschritter, et al.

Studies have shown that people with monophasic curves after a large carbohydrate load tend to be less metabolically healthy: they tend to have lower insulin sensitivity, higher glucose levels, higher fasting insulin levels, and higher insulin levels two hours after glucose intake, as compared to those with a biphasic curve. Those who exhibit a monophasic curve also show increased rates of metabolic dysfunction and impaired glucose metabolism.
Another study showed that obese individuals who exhibited monophasic curves after an oral glucose tolerance test (a standardized test where individuals drink 75 grams of glucose and then test how glucose responds) had lower insulin sensitivity and pancreatic beta-cell function than those with a biphasic curve, and were more likely to have an increased risk for type 2 diabetes. The pancreatic beta-cells produce insulin in the body, and we want these to be as healthy and responsive as possible.
A third study looked at one group with normal glucose tolerance and another in which this tolerance was impaired. The subjects were categorized into monophasic or biphasic responders. Those who exhibited a biphasic curve had a higher percentage of normal glucose tolerance, were younger, had a lower BMI, lower plasma glucose and hemoglobin a1c, and better insulin sensitivity.
So what’s happening from a physiology perspective? It may have to do with the two phases of insulin secretion after glucose intake.
- Insulin is released from the pancreas to help cells take up glucose from the blood.
- The first phase of insulin secretion occurs quickly after glucose intake and lasts a short amount of time, and the second phase is later and sustained.
- For those who display a monophasic curve with a single peak after glucose intake. The first phase of insulin secretion appears to be decreased and impaired.
Those with a biphasic curve display better insulin secretion during the first phase and have greater insulin sensitivity. This leads to an early fall in glucose followed by a rebound increase, hence the two peaks on the curve. There may be other factors involved, like how fast the stomach empties (slower emptying means the slower entry of glucose into circulation) and additional hormonal factors.
In summary, biphasic curves after a large glucose load are associated with:
- Better health outcomes
- Lower glucose levels
- Lower fasting insulin levels
- Lower BMI
- Higher insulin sensitivity
- Lower rates of impaired glucose tolerance and metabolic syndrome
It’s important to stress that there’s no need to try to eat in a way that produces a biphasic curve! Ideally, you’ll see virtually no spike at all after eating a meal. A low and stable glucose curve is ideal for health. The studies referenced in this post generally are looking at glucose patterns after a formal oral glucose tolerance test, during which participants consume a drink containing 75 grams of glucose (that’s a lot!), an amount much more likely to produce these curves, and which also will likely generate a significant insulin release.
What does this mean for you?
While we can’t extrapolate real-life meal scenarios from controlled research that uses standardized glucose drinks, it may be interesting to look for patterns in your glucose curve after a high carbohydrate meal, as it is one piece of the overall puzzle of putting together metrics that tell us about metabolic fitness.
While a biphasic curve response to a specific meal/challenge is associated with better health outcomes, it’s important to note that lots of spikes and dips throughout the day, and, more specifically, high glucose peaks after meals, are considered risk factors for poor health outcomes, so we should never be striving for peaks. The ideal glucose curve is fairly flat throughout the day, with minimal dips or peaks, and remains within a low and healthy range.
Other additional factors can also affect the glucose curve, including what you’ve eaten earlier in the day, stress levels, amount of sleep, exercise patterns, or additional calories consumed after a meal. Using continuous glucose monitoring may reveal your individual patterns, offering insight into your own glycemic regulation and giving you the data to improve your metabolic fitness over time.