Levels’s Head of Research and Development Dr. Taylor Sittler, Levels’s Head of Business Maz Brumand, and one of Levels’s advisors Dom D’Agostino, PhD, discuss our large-scale observational research study to gather CGM data from members, why this data is so important, and what it can mean for the future of the metabolic health field and of medicine in general.
What is “Normal”?
Dr. Taylor Sittler: Thank you both for coming to this event today for our little podcast. We’d like to provide some context and give people both some background for the study of glucose, and an idea of why they would want to participate in it. Dom, your experience in the field would be really helpful, and any thoughts you have on similar studies that have been impactful could be helpful.
Dom D’Agostino: I taught a class in this, and I had a very conventionally trained physiologist who is part of the American Diabetes Association and everything. The big thing that she always harps on is that we have no idea what normal glucose is. We just don’t have the studies. Nothing like this has been done, so this is really spearheading a major effort that’s going to give very important information to the field: what normal glucose is.
Dr. Taylor Sittler: As you mentioned, there really aren’t large studies available. We have a lot of data now on how glucose patterns can impact people with diabetes and what those look like, and we’re even learning how to manage diabetes with some of those patterns. It can be used to determine therapeutic doses of insulin, to raise or lower doses of other oral medications, and things like that.
But what we really don’t know is, “What are the patterns of glucose that are present in prediabetic folks and folks who don’t have these diseases?” Understanding that can lead to some major breakthroughs if we do that well.
Dom D’Agostino: Someone can have normal glucose, but their postprandial response could be way out of line. Their insulin levels could be ten times higher. They could be pumping out ten times more insulin to maintain that level of glucose. And that would show up in the CGM data, because it had impaired insulin resistance. You’d see a bigger postprandial excursion in glucose.
The biggest thing my colleagues harp on is that, unfortunately, we just do not have data on non-diabetic subjects on what normal glucose is in normal glucose responses. That’s why this study is super important.
Levels Large-Scale Study
Dr. Taylor Sittler: We’re conducting an observational study, collecting information from people who are using Levels. Basically, from the data that are collected in that process, what we expect to see are changes in glucose. With some people, about 60–70% of people who use our application, also log the food they eat and the exercise they’re doing. We can see in time how these glucose patterns are correlated with particular events they log for us.
What do you think would be the biggest impact of this kind of data on people? If we’re able to see that in 50,000 or 100,000 people what patterns do you think will emerge?
Dom D’Agostino: In addition to establishing what normal glucose is, assuming it’s the fasting level being under 126 mg/dL and things like that, then we’ll start to get some understanding of—and I think this is super important for the use of CGMs—the personalized response that people may have to different types of food.
Especially if this is coupled with other things like changes in weight, or perhaps the particular type of diet they’re following, you could start to garner insight into how different people’s metabolisms are, and that we need to acknowledge that we can’t apply a cookie cutter-type diet to everybody and expect them to maintain glycemic control when some people may be much more carb-tolerant than others.
There are a lot of caveats to using other means to gain information on this. An oral glucose tolerance test, for example, is going to give you a false response for someone who’s on a low carb diet, because their body is adapted to burning and metabolizing glucose for fuel, or fats for fuel, so they’re not going to tolerate glucose.
In many fields of science, we have this baseline data and understanding, but interestingly, and this was even discussed at the American Diabetes Association conference I attended, the field generally agrees that we do not have a good understanding of what normal glucose is, and what a normal glucose response is to dietary patterns.
Dr. Taylor Sittler: There are some parallels to some of my previous work, which was in genetics. When we started Color Genomics back in 2013, 2014, there really wasn’t any baseline data on the population specifically around the genes that put you at risk for cancer. A lot of people would get test results back with these unclear variants. People weren’t sure. A medical geneticist might postulate, “This could actually be very risky for somebody to get cancer,” and another might say “No.”
Color was really dedicated to making genetic testing a part of primary care, at least in its early days. We initially ran 10,000 samples across a genetically diverse population, and we were able to describe a lot of these variants that people didn’t understand ahead of time. Being able to see what the background frequency is of all these variants was extremely powerful to helping us understand which variants would put someone at risk for cancer, and what some of the potential mechanisms were.
I think whenever you have a technology that’s grown up in the context of a particular disease, you have this problem where, in the case of CGM, it’s always been used for monitoring diabetes. When you broaden that, there can be so much more power to it, but you really need to be able to understand what the baseline looks like before you can start attaching any kind of meaning to the patterns, as you said earlier.
The postprandial patterns, for instance, or understanding what baseline fasting glucose looks like for people overnight, or waking glucose in the morning: For a lot of people, glucose will jump up a little bit in the morning once they get up, and what does that look like?
I think to everybody on this call the value is super clear, but I think, if you haven’t been involved in one of these projects, it’s hard to understand why we would want to measure it on 50,000 people.
On the Individuality of Health and Disseminating Information
Maz Brumand: If I were to summarize what you guys are saying, we don’t know what’s normal. What’s the baseline of what’s normal? Especially when you think about different genders, different ethnicities, and understanding that is the place to start. When I see this rise when people wake up, is that normal? Or is that because their anabolic system is dysfunctional? That seems to be where we want to start, and then build on that to figure out what is abnormal and how we think about that in terms of behavior.
Dr. Taylor Sittler: Yeah, 100%.
Dom D’Agostino: There’s a variety of snips throughout the population that could make a dietary pattern favorable or unfavorable. We published a review on this, in the context of a low carb diet, with Jeff Folick and Lucia Aronica. It was published a few months back. You’re not going to know that if you don’t have CGM data, and, of course, the foods people are eating.
Occasionally you come across people who are completely intolerant to a high fat diet, a ketogenic diet, which is what we study. Undoubtedly, they have a deficiency in a fatty acid oxidation enzyme, or maybe a lipase enzyme. That would probably show up with genetic testing, but not everybody’s going to do that.
A CGM would really give you insight, especially when it’s coupled with other biomarkers Levels is doing, especially insulin. We don’t have any really good standardized reference ranges for insulin, and it’s not even part of a metabolic panel, which is amazing. If we get CGM data and couple it with other biomarkers, which I know you’re doing, then it becomes exponentially more informative.
Dr. Taylor Sittler: It’s really exciting. I’m also excited to see, once we start to have this data, how we’re able to get it out to folks, as Color was eventually able to do. Once you can publish that data and give the whole field a reference range, it really helps a bunch of other folks and investigators be able to then look into specific patterns. To Maz’s earlier point, they can start to understand what’s normal and abnormal.
Dr. Taylor Sittler: It’s going to be really exciting, not just to collect this data, but then to be able to collate it and get it out there for people to be able to understand and make future contributions to it.
Maz Brumand: Today the data on healthy people is very scant. The first thing we need to do is understand what the actual baseline for people who are healthy is.
Obviously, we want to help people improve or maintain their metabolic health. What is the arc of this? If we fast forward five years, how does this research contribute to the end goal? How does this create the stepping stone to get to where we all want to go?
Dom D’Agostino: I think as we collect data and publish it, it becomes a framework, because CGMs will be more accessible for people. When they’re using CGMs, they will have an existing framework to titrate and adjust their diets, whether it’s the macronutrient composition or the amount they’re eating per meal, to stay within a particular reference range. Generally speaking, the field in metabolism would agree that a postprandial excursion to 120 is much more favorable than 220. You’re not going to know that if you’re not using a CGM.
CGM and Level software make it actionable. Having metabolic awareness, the software then becomes a behavioral tool to modify the types of food you’re eating and the amount you’re eating to optimize within reference ranges.
It may take some time to get people in metabolism and endocrinology to agree on what’s optimal, but I think, generally speaking, one could say lower is better. Excluding hypoglycemic ranges, pretty much every endocrinologist or metabolic expert is going to agree that a lower average glucose and a lower postprandial glucose is better and more indicative of metabolic health. You’re not going to know that if you’re not using a CGM.
Maz Brumand: One of the things we’re trying to do at Levels is to not only tell people things that work—for example, an excursion is bad—but also things that people can actually do and adhere to in a way that’s easy and sustainable.
For example, it may be easier for somebody to keep the area under the curve small. If research proves that’s the thing we should go tell people, to keep the area under the curve small versus trying to avoid spikes, or vice versa, maybe that avoid spikes thing is more speculative.
Some of this research will help us understand more than just where the ranges we’re asking people to do are, because it comes at a cost. When you tell people to keep their glucose within a reference range, they are thinking of it as, “I have to give up my ice cream at night,” or “I have to give up the orange juice I enjoy with breakfast.”
The question we try to ask ourselves is, “What is the thing with the lowest burden we can tell people to do that they will continue to engage with, and that will have the highest efficacy?” This research helps us to get there. We ask people to do the bare minimum in order to achieve the most effective outcome.
Dr. Taylor Sittler: We’ll start with these very large trials where we’re just collecting observational data. Over time, that allows us to start to publish this baseline and some of these reference ranges in these different variables. We probably won’t publish the whole traces, but we’ll publish what the normal fasting windows might be, or the normal windows of postprandial responses. Or, looking at different patterns, we’ll understand what those normal windows are, and hopefully, to some extent, how they correlate with some genetic markers.
What I’ve certainly seen, in other situations, is that people are different. There’s a range you need to get, and understanding what group you belong to is super helpful in figuring out what those ranges are. We’re not all the same.
I would see us collecting this data, establishing some of those variables and ranges. Once that starts to get out into the public domain, that enables a bunch of researchers to use that data, refine it, and really establish for the field what those reference ranges are.
Then we can start to internalize some of that and tell our members, “Hey, this looks abnormal. You may want to change this. You may want to fix that.” Once those baseline numbers start to be agreed upon, we can really use that to help people modify their behaviors to improve their health. Hopefully within the first couple of years we’ll be able to start doing that.
Once we get some data back on which of those interventions is effective, based on these variables we’ve established, we can start to say with some certainty what’s working therapeutically.
What I see in the more distant future, based on what I heard from you two, is there might be almost-approved therapies where we can say, “This diet is really going to help you out, or this fasting regimen, or this exercise regimen,” or “Looking at these particular things could be really helpful for you.”
That’s the arc I’m hearing from what we’ve discussed. Does that resonate with what you all are thinking?
Dom D’Agostino: Yeah, that makes great sense. Instead of treating a disease, which is what modern medicine is, health optimization medicine, if you want to call it that, can get ahead of the problem and start to prevent the problem from occurring in the first place.
If we know what healthy is, we can start, as people trend toward prediabetes, maybe understanding the CGM curve, or, if they are in the context of a postprandial response, approaching Levels. Maybe this study could further define what it means to have prediabetes or diabetes.
Like I said, my colleague, Dr. Barbara Hanson, has done some work on insulin and how insulin increases exponentially as we age. You need to pump out more insulin to maintain certain blood glucose levels. That would show up, and the glycemic response to a meal would show you that insulin resistance.
Elevated insulin is always indicative of insulin resistance. I think Ben Bikman would confirm that statement. You could measure insulin, or you could measure the glycemic response to a meal, which shows insulin is not working. You’ll glean really informative information from this observational study, which just has not been done before.
Learn more:
A Baseline for Health
Maz Brumand: One thing you mentioned that really resonates with us at Levels is this progression of health. We start in our twenties, and we’re super healthy and we’re super resilient. We can take on anything and feel invincible. As we progress into middle age, you’re not sick yet, but you just don’t feel as well as you did before. You probably can’t endure as many hours of intense activity, or whatever you’re doing. At some point we categorize that profession as disease if there’s dysfunction happening in our physiology.
When you say, “Maybe this is what a glucose response looks like for anybody in his 20s, who also doesn’t have a disease,” and you turn from that healthy person to a still healthy 40-year-old, there is some degradation happening naturally. As you go from that healthy 40-year-old to a 50-year-old with a disease, there’s another change.
But what does this spectrum actually look like? Can we identify that a.), this is happening—that it’s not your imagination, we’re getting old—and b.), what are the things we can do to maybe slow that down so you don’t progress into that disease state, or slow down that progression? Is that something this research can at least set the groundwork to achieve?
Dom D’Agostino: I think it can be part of that overall framework. Thinking about it from a low tech perspective, there are what you would call “functional biomarkers.” If you’re 40 years old, you can do X amount of pushups, and if you could do 20 pushups at 80, you’re going to be in that one percentage of people.
If you take that person who can do 20 pushups at the age of 80, and have them wear a CGM, that CGM profile would look really, really good. He would maintain that level of metabolic health. Metabolic health is to a large extent tied to skeletal muscle mass, and one low tech way to monitor it could be to focus on optimizing that muscle mass, and then paying attention.
There are blood biomarkers that can help inform you to optimize your function, whether that be endurance activity, or strength training, or whatever your sport is. A CGM could help with that.
I look at it in various ways. There are functional biomarkers, and then there are physiological things like blood pressure. You have to look at the complete picture, but the continuous glucose monitoring is probably the best. Like a dashboard in a car, if your body is an instrument and you need a dashboard, the glucose level is probably the most important instrument to look at for your fuel flow.
Knowing how we use that fuel is powerful. If we have excess calories, that’s going to produce a very predictable rise in glucose, and a persistent elevation of glucose and insulin that’s going to impact our overall longevity over time. We would not know that if we didn’t have a CGM device.
Dr. Taylor Sittler: What I love about this discussion is that it takes the traditional approach to doing clinical studies and flips it on its head. We’re talking about establishing a baseline for health, rather than a baseline for disease. That’s really what’s so powerful. We’re moving into an era where we’re going to be able to define what it means to be healthy rather than what it means to be sick, and then we can start to optimize toward that.
If you think about it, whether from a statistical and machine learning perspective, or even from a basic clinical perspective, if you’ve got a single goal—that being health—it’s much easier than optimizing away from diabetes, away from cardiovascular disease, away from Alzheimer’s, which is unfortunately what every primary care doctor has to do in the 15 minutes they have with patients. That’s what I think is so powerful.
The way you described it, Dom, really triggered that for me. If we do our job correctly with this observational study, we’re helping to develop, as you mentioned, that bigger framework to be able to understand what it means to be healthy. Once we understand that, we can start identifying patterns that will lead back to health.
It’s a new way of doing medicine. It’s a new way of optimizing for longevity, and for optimizing for prevention of disease. I’m pretty excited about it. We’re lucky to have folks like you helping us out, because you’ve been building this framework for years already. It’s great.
Dom D’Agostino: The definition of healthy used now is not really healthy. In our study, we have non-diabetic subjects entering the clinical trial we’re running with Dr. Alison Hall, and 80% of them have hepatic steatosis. That’s reversing quickly and correlating very nicely with improved CGM data or glycemic responses.
Our conventional standards for healthy need to be modified. Health is on a spectrum: we have optimal health, suboptimal health, and, on one extreme, a pathological condition. We need to move toward optimizing, especially when we’re young and we have better control over our health. If we get ahead, that’s going to pay big dividends in the future. That’s the major contribution this study can have: defining what’s normal and what can be optimal. We just don’t have that data now.
Maz Brumand: It seems like the problem starts from measurement, because it’s very hard to know where you are on that spectrum before it’s something you can measure. When you’re sick, you go to the hospital, and you measure it at that point. But before that point, it’s really hard to measure. This step is starting to measure that progression of super healthy, to kind of healthy, to, “Oh boy, you’re about to hit that brick wall,” which is the disease.
Dr. Taylor Sittler: If you’re coming in with fatty liver disease, you’re close. It’s not far away anymore.
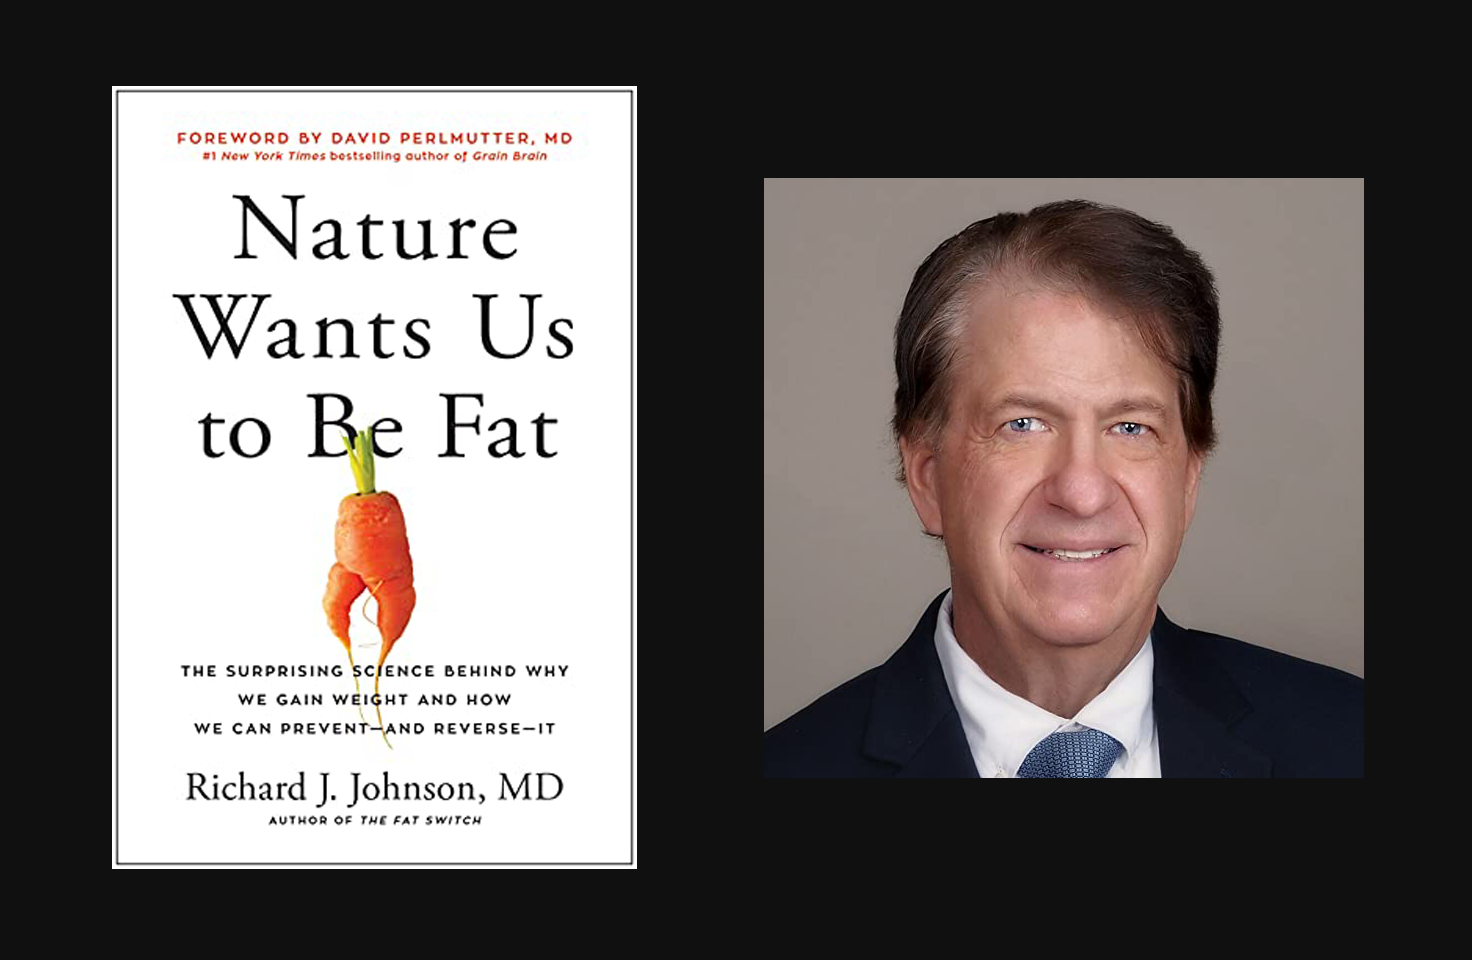
Dom D’Agostino: That’s a silent killer, and it’s probably from, as Dr. Rob Lustig is saying, excess sugar and fructose, which probably show up in a nice CGM profile. But these things creep up on you in ways that are kind of sneaky. It’s super important to get ahead of that.
Limitations and Considering Variables
Dr. Taylor Sittler: Is there anything else you all feel like we should talk about before we wrap up here?
Dom D’Agostino: It’s going to be important to understand if subjects will be reporting their weight. There’s a big discussion about whether being closer to your ideal weight gives you better glycemic control, whereas some people can maintain a higher body weight and still have proper control.
This may add some insight into how important body weight is, changes over time, and how that will reflect glycemic control. That’s an important question that’s often talked about, at least in our class at the medical school—the importance of a body weight and achieving a caloric deficit to improve insulin sensitivity.
Dr. Taylor Sittler: The study is observational, so we’re really just collecting whatever data people are offering to us. As a Levels member, you can connect your account to your Apple Health data. Some folks are measuring their weight and keeping it in there. For those folks who are willing to share, I think we will learn a lot.
It is also the nature of this observational study that it’s not completely consistent. We’re not going to get everything from everyone. We wouldn’t demand that—that would be too difficult. But we’ll, hopefully, learn a lot from those willing to share.
This will definitely enable us to pose hypotheses for future studies. It may be that that’s the second Levels study we do next year, based on some of the data we’re collecting, and that we understand that better down the line.
Maz Brumand: It speaks to why this study is large. We designed the study to be a minimal burden on people so we can get more people to participate. For that, we decided to make it operational so that you’re doing what you’re doing, and we’re just collecting.
The size of it will speak to the diversity and the personalization we’ve been talking about. By being this large, hopefully we can capture a lot of different types of people and the way they live, whether they come from different backgrounds, whether they come from different genders. The size and the low friction have to go hand-in-hand for it to work. You can’t have one or the other.
We will get a lot of information about a lot of things. We can investigate, “Is the correlation between body weight and glycemic response or metabolic function?” or “Is there a one-on- one correlation, or is it a one-on-one correlation only if you have these things—if you are this age, or if you are of this genetic background?”
It’s really exciting to see all that data and then design personalized interventions based on those compounders that can actually work for people.
We hear it all the time: “Hey, why does this work for so-and-so, and it doesn’t work for me?” Hopefully we can have enough information and say, “The reason it works for so-and-so is because of X, and the reason it doesn’t work for you is Y. And now we have something that actually will work for you, but it will be different.” I’m pretty excited about that.
Dom D’Agostino: That’s a great point. There’s huge power in numbers and statistics when you have such a robust and large data set. You can glean a lot of insight.
Maz Brumand: I always have people say, “Hey, why is my friend eating really terribly, but looks great, and I’m doing everything right and I’m overweight?” And I think, “Well, it doesn’t mean…”
There are so many layers you need to unpack to answer that question versus saying, “It’s okay to eat terribly because it will work for somebody else, or at least it appeared to work for somebody else.”
Dr. Taylor Sittler: One thing we can definitively say at this point is it’s not simple. If it were simple, I could give you some advice. Somebody would have years ago, and we’d have the algorithms we need. But it’s definitely not simple.
Dom D’Agostino: The best way to go about it is to cast a wide net and collect this observational data, and then figure out what the important testable hypotheses, which will really be the first of its kind. It’s exciting that Levels is spearheading this, and I’m excited to be part of it.
Maz Brumand: We really appreciate the involvement from you and all the researchers that make this real. This is just the first step. This is the beginning. The hard work is to come.
How Ketosis Can Impact Performance and Certain Biomarkers
Maz Brumand: Thanks, Dom. I’ve been on keto for the last three, four months, and it’s changed my athletic performance.
Dom D’Agostino: I’d be glad to discuss it.
Dr. Taylor Sittler: Out of curiosity, what is the biggest change for you, Maz?
Maz Brumand: We’re going to get into a deep rabbit hole here. I’ll give you a short version. I’ve actually been forced to train in zone two and zone three because I have no glycogen stores, which has increased my average power output, or probably my micro density or efficiency, because I’m not actually going into zone three and four.
The courses I ran and I rode are the same. Let’s say my Functional Threshold Power was 130 W. It’s gone to 180 because of that forced training over and over at that high intensity, but with no glycogen to use. Now I can output a lot more power in ketosis than I could have, even without ketosis, in the past. My average power now, just in zone two and zone three, is higher than when I averaged over zone five. That was an unanticipated outcome for me, which is pretty cool.
Dom D’Agostino: How long did that take? There’s an adaptive response to the ketogenic diet that occurs over time. Some people have performance decrements when they start, and then there’s a compensatory adaptation.
Maz Brumand: When I went on ketosis, during the first month, I thought, “God, I’m really out of shape. I used to be able to run up hills and I can’t do that.” I had a massive degradation of performance. It took me about three months to surpass my previous peak.
Dom D’Agostino: That makes sense. That’s in line with me. Even with strength, my bench press and squat went down. My deadlift didn’t change that much, but it took about two or three months to come back.
Maz Brumand: That’s fascinating. I didn’t expect that. Are you now above your previous beat?
Dom D’Agostino: No. I have different goals now. I started with the keto 12, 13 years ago, but my goals were for longevity and health optimization. Back when I started, it was more about size and strength and things like that. I’ve lost quite a bit of weight, maybe 20, 25 pounds, but I’m better. I feel better at this weight. I don’t need to consume as much food to maintain my weight, and I feel lighter on my feet.
Maz Brumand: I did it for health, too. This was a surprising output, that activity. I don’t know if it’s related to ketosis, but my lactate and uric acid levels are totally disrupted. I have higher uric acid than I ever did, and I don’t eat fructose, obviously, because I’m on a ketogenic diet. It’s really weird that my uric acid is so high, and it may not be related at all to keto.
Then lactate is also all over the place. My baseline is about 2.2. If I measure my lactate right now, sitting here, it’ll be two and change. That’s really surprising to me. I don’t know if that has anything to do with ketosis, or if it’s a completely orthogonal problem.
Dom D’Agostino: That’s interesting you mention that. I have uric acid? Sure. Gassed? Sure. Mine’s pretty low. I had some meals that were off. I noticed alcohol, red meat, and carbohydrates will increase it, and then with fish, veggies, and things like that, it drops pretty low and stays low. I’ve been emailing Dave Perlmutter back and forth on that.
When you start a ketogenic diet, the ketones compete with uric acid for excretion. That could make your body retain more uric acid. Jeff Volek has written about this. It can take four to six months for that to normalize.
Maz Brumand: That’s interesting. The way I found out is I developed gout. It was so intense, because I was going on fasted. I would fast 16 hours, do a ride, and then come back and eat. I think the combination of fasting, high activity, and ketosis was causing massive spikes in my uric acid. I thought, “What the heck is this? I’ve never had this before.” It occurred after I changed that protocol, so that makes sense.
Dom D’Agostino: It could be some protein breakdown if your purines are high—if you’re eating a lot of liver, organ meats, or no red meats.
Maz Brumand: No: fish, vegetables, that’s pretty much it.
Dom D’Agostino: That’s interesting.
Dr. Taylor Sittler: Keep tracking that, because it would be interesting to track that over time.
Maz Brumand: I’ve got a bunch of data, and I’m happy to share it. I also recently got a device to register lactate. I’m basically recording uric acid and glucose. It’s “n of one.” And obviously I use a keto meter.
Dom D’Agostino: I’d be interested in your lactate response to exercise, and whether you measure your lactate at a fixed output or exertion level.
Maz Brumand: After a big ride, my lactate goes down, interestingly enough. I expect it to go up. Are you saying get on a stationary bike and see at what point lactate starts skyrocketing?
Dom D’Agostino: Yeah. If you happen to have measured it before you started the ketogenic diet, it might be a little bit more informative, but measure it when you’re under a load. I did this to Peter Attia.
I was poking his finger and getting blood out of him as he was maintaining 180W. A long time ago, when we were doing some NF1 stuff together, I was measuring glucose and keto and some lactate. Lactate goes down quite remarkably once you’re adapted to the ketogenic diet.
Maz Brumand: Awesome. Sorry to jam you on the end of this thing. The work that you’re doing is really fascinating. The ketogenic diet, and ketones as a fuel source, has changed my world. I’m really, really happy you’re working on it.
Dom D’Agostino: Great to hear. It’s a fun area to be in.
Dr. Taylor Sittler: This is good, because I actually stopped exercising when I had a kid. Now you both convinced me that I’m definitely going to be full ketone before I get started again, so I won’t remember how bad I was when I get back into it. I won’t feel that I’m any worse, because it’s just starting up again.
Dom D’Agostino: I don’t have kids, but I can’t understand how you guys manage that. I know kids are a full-time job. Doing that, and working, and having to work out, becomes tough, I imagine.
Dr. Taylor Sittler: It takes a little while to do the juggling. COVID threw an extra wrench in there. But I’m almost back, actually. I started running again. And I’ve been doing 16 hour fasts for a couple of months. I’m sure when I get started doing higher output workouts, it’s going to slap me right in the face.
Thank you guys very much. This is great. Dom, really appreciate you taking the time after work.
Dom D’Agostino: Yeah. Glad to do it.