The Zone Score (sometimes also called a Meal Score) quantifies how foods and activities, in combination, affect your blood sugar levels. Scores range from 1 to 10, with 10 being optimal. To calculate this score, we look at several aspects of your glucose response in the two hours following a logged meal.
Below, we explain the rationale behind Zone Scores and provide more detail about how we calculate them.
The feature and why we built it
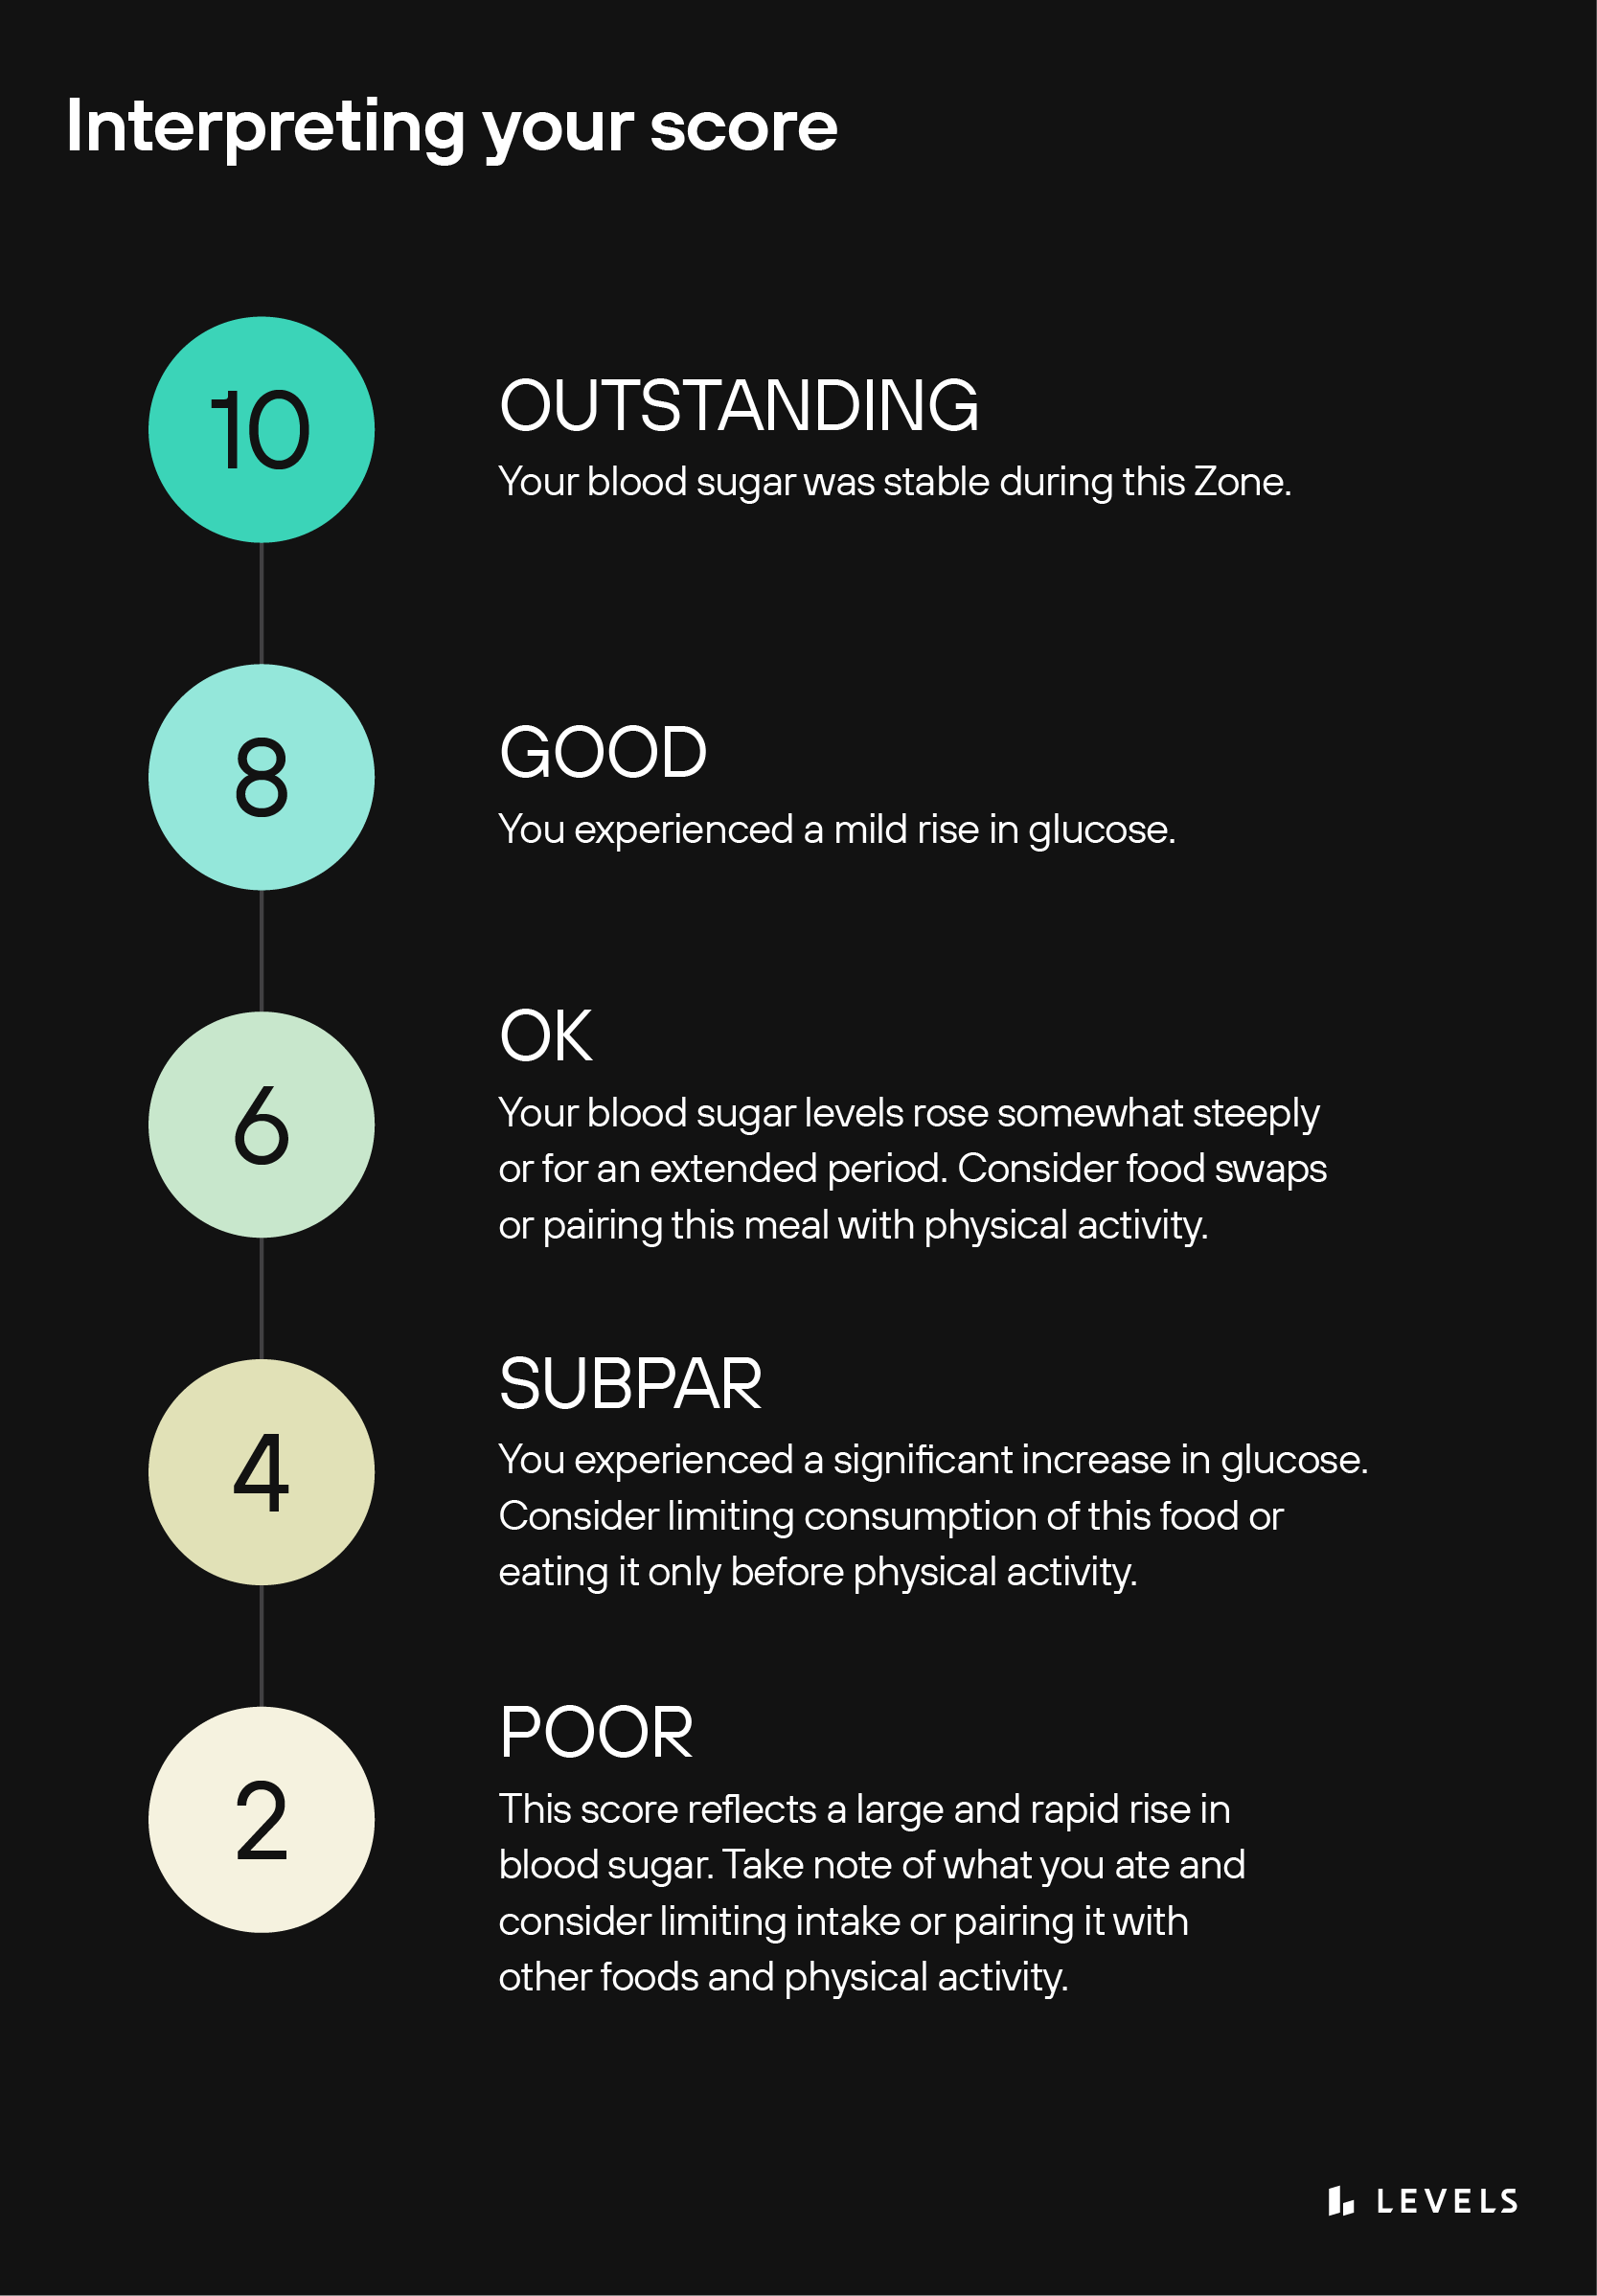
This Zone Score rewards gradual, minimal changes in glucose because stable blood sugar supports quality of life in the short term and metabolic health in the long term.
A Zone is a roughly 2-hour window following a logged meal. The Zone *Score* aims to capture how your glucose levels respond to everything you do during that window (i.e., not just food but also physical activity, stress, and more).
Levels developed ‘Zones’ to reflect that you don’t eat food in a vacuum. How your body responds to a given ingredient depends on what you do before and after you eat it: Are you consuming other foods? Going for a jog? Going to sleep? All those factors influence glycemic response, and your Zone score reflects that interaction.
The Zone Score also takes into account the macronutrient content of what you eat. While a fairly stable glucose response is ideal, it’s not the only thing that determines how metabolically healthy a meal is. You could eat bacon and drink vodka all day and get a stable glucose line, but it wouldn’t make you healthy.
Generally speaking, you should aim to consume enough protein and fiber, while minimizing carbs (especially refined or naked carbs) and unhealthy fats. You should also favor whole foods over processed ones, and avoid highly refined seed oils.
With the scoring system, the goal is not to achieve a perfect 10 every time. Instead, by offering a simple record of each Zone, we hope to help members track how various combinations of foods and activities affect their bodies. You may find, for instance, that eating an apple on its own leads to a Zone Score of 6, but an apple followed by a walk generates an 8. This simple, quantitative difference may be a helpful way of thinking about how to approach your food and your days.
🥗 Levels recommends aiming for a zone score of 7 or above on most meals.
Strategies for bumping up your Zones Scores include:
- Swapping out low-scoring foods for metabolically-healthy alternatives (e.g., try cauliflower rice in place of white rice).
- Adding fiber to your meal
- Pairing carbohydrates with fat and protein and eating carbs at the end of your meal
- Walking after your meal
- Avoiding stressors, particularly around mealtime
- Consistently getting enough quality sleep
How we calculate scores
To calculate your Zone score, we look at two primary factors:
- How much your glucose rises following your meal in total. We look at this through two metrics: the maximum height of the glucose rise, and the total rise, or Area Under the Curve (AUC), which reflects both the height of the glucose rise as well as the length of time your glucose is elevated. Though moderate changes in blood sugar are perfectly normal and healthy, big surges or long periods of elevation indicate that you’re consuming sugar faster than your body can use it. Smaller increases, therefore, earn higher scores.
- How quickly your glucose rises. Metabolically-healthy food tends to produce a slow, gentle rise in blood sugar. Carb-rich and processed foods, by contrast, quickly flood the bloodstream with glucose. To keep your score high, aim for less steep slopes on your glucose graph.
In addition to glucose dynamics, we also consider the quality of the food you log, including its macronutrient and micronutrient content, and whether it is highly processed or contains seed oils.
- Meals high in protein, fiber, and healthy fats—which can blunt glucose rises and help improve metabolic health—will improve your score. Meals high in carbohydrates—which drive glucose rise—or unhealthy fats will lower your score.
- Meals that contain foods that are highly processed or contain seed oils are detrimental to overall health and can drive inflammation, obesity, and other damage, so these decrease your score.
- Foods rich in micronutrients such as vitamins and minerals, which support the healthy functioning of all our body’s processes, can boost your score.
However, these factors minimally impact your final score:
- The maximum change you can get from macros is ±1 point.
- The maximum change you can get from ingredient quality is -0.6 points.
It is normal and healthy to see moderate changes in your glucose levels. Very large and steep spikes, however, can be a sign that you’re overwhelming your body with sugar. To boost your score, aim for hills, not mountains!
A more detailed step-by-step of the Zone score calculation
This is a technical look at how we calculate the Zone score. Note that while we’re providing the formula here, it’s not something you could replicate on your own, given the information available in the app. For example, the rate of accumulation for the Area Under the Curve is something we can calculate, but is not precisely available in the app.
1. Calculate the scores for each component.
Glucose Delta
If the value of the Glucose Delta (the change in glucose during the zone) is ≥ 5 mg/dL, the score changes according to the following formula:
Glucose delta deduction = 1 – ((GlucoseDelta – 5) / 65)
- By definition, if the value of the Glucose Delta is ≥ 70 mg/Dl, the Zone Score will be 1 (meaning you can’t be further penalized for a spike greater than 70 mg/dL).
- The Glucose Delta is calculated by taking the difference between the highest glucose value in the zone and the Zone’s Glucose Baseline.
- The Zone’s Glucose Baseline is the average glucose during the one hour prior to the start of the Zone.
Slope of Glucose Change
If the Slope of Glucose Change (i.e., the sharpness of the spike) exceeds 2 mg/dL per minute, the score changes according to the following formula:
Glucose slope deduction = 1 – ((GlucoseSlope – 2) / 13)
- By definition, if the Slope of Glucose Change exceeds 15 mg/dL per minute, the Zone Score will be 1.
Area Under the Curve
Similarly, if the Area Under the Curve (meaning the total volume of the glucose rise) accumulates at > 2 mg/dL per minute, the score will change according to the following formula:
Area under curve deduction = 1 – ((AreaUnderCurveRate – 2) / 18)
- By definition, if the Area Under the Curve accumulates at ≥ 20 mg/dL per minute, the Zone Score will be 1.
2. Take an average of values calculated in step 1 to generate a composite score.
3. [If available] Adjust the score based on the macronutrient content in the Zone.
For every meal log in a Zone, we sum up the macronutrients (protein, fiber, etc) from all the foods in that log. We then sum up the macronutrients across all logs in the Zone to determine if the macronutrient totals should affect the Zone Score using the following thresholds and score impacts:
- High Protein: ≥ 20g of protein ⇒ +0.33
- High Fiber: ≥ 10g of fiber ⇒ +0.33
- High Healthy Fats: ≥ 5g of monounsaturated fats ⇒ +0.33
- High Unhealthy Fats: ≥ 5g of trans+polyunsaturated fats ⇒ -0.5
- High Carb: ≥ 30g of carbs ⇒ -0.5
4. [If applicable] Adjust the score based on the quality of the ingredients in the zone.
If any of the ingredients in the log are tagged in our food database with one of the following, we make the corresponding adjustment to the score. Note that each adjustment can only be applied once per Zone, so even if multiple ingredients have the same tag, you are only penalized or rewarded once.
- micronutrient: +0.1
- highly_processed: -0.3
- seed_oils: -0.3
5. Round the composite score up to the nearest integer and multiply it by 10 to generate a number between 1 and 10.
- If the number is less than 1, we round up to 1.
Notes:
⭐ Note that our engineers are constantly working to improve app features, so the above may not precisely match the current zone scoring algorithm.
⭐ No score will be calculated if you don’t have data sufficient to generate a baseline or during the 2 hours of the Zone.
Exceptions, notes, and caveats
The Zone Score is just one way of thinking about your glucose dynamics. If you prefer to stick to raw numbers instead of scores, you can look at your post-meal glucose levels, average glucose, or glucose standard deviation in the app.
Although we created our Zone Score formula from components of peer-reviewed studies on healthy glucose variability, the Zone Score is not yet a clinically validated tool.
On “megazones”
Note that a Zone will extend beyond two hours if you log an additional meal during this period—the clock effectively restarts with each log. For example, if you log bacon and eggs at 8 am, your Zone will end at 10 am. However, if you log Greek yogurt at 8:45 am, your Zone will extend until 10:45 am; if you also log a latte at 10 am, your Zone will extend until 12 pm, leaving you with a 4-hour Zone.
Indeed, if your logs are consistently under 2 hours apart, your day might look like one giant “megazone” rather than several shorter Zones. To avoid this, our Support team recommends logging multiple foods at once rather than creating separate entries. You can also edit your logs after the fact to consolidate logs.
“For instance, if you logged salad at 4:30 pm and then some almonds at 5 pm, you can edit the logs so that there’s just one ‘Salad and Almonds’ entry at 4:45 pm,” says Support expert Sunny Negless.
Exercise
The app won’t display a score for Zones with exercise alone because physical activity positively affects metabolic health (even if it causes a temporary spike in blood sugar). Be sure to log strenuous physical activity to avoid losing points for an exercise-related spike.

 Ready to see how Levels can help you?
Start taking action today to optimize your metabolic health so you can feel better and live a longer, healthier life. Levels members get access to the most advanced continuous glucose monitors (CGM), along with an app that offers personalized guidance so you can build healthy, sustainable habits. Click here to learn more about Levels.